RentRedi’s Portfolio Performance Now Tracks the NOI, Cash Flow, Cash-on-Cash Return, and Equity of an Entire Rental Portfolio in One Dashboard
Newly expanded analytics suite eliminates manual tracking for independent landlords, providing the kind of portfolio-wide financial visibility once exclusive to institutional investors
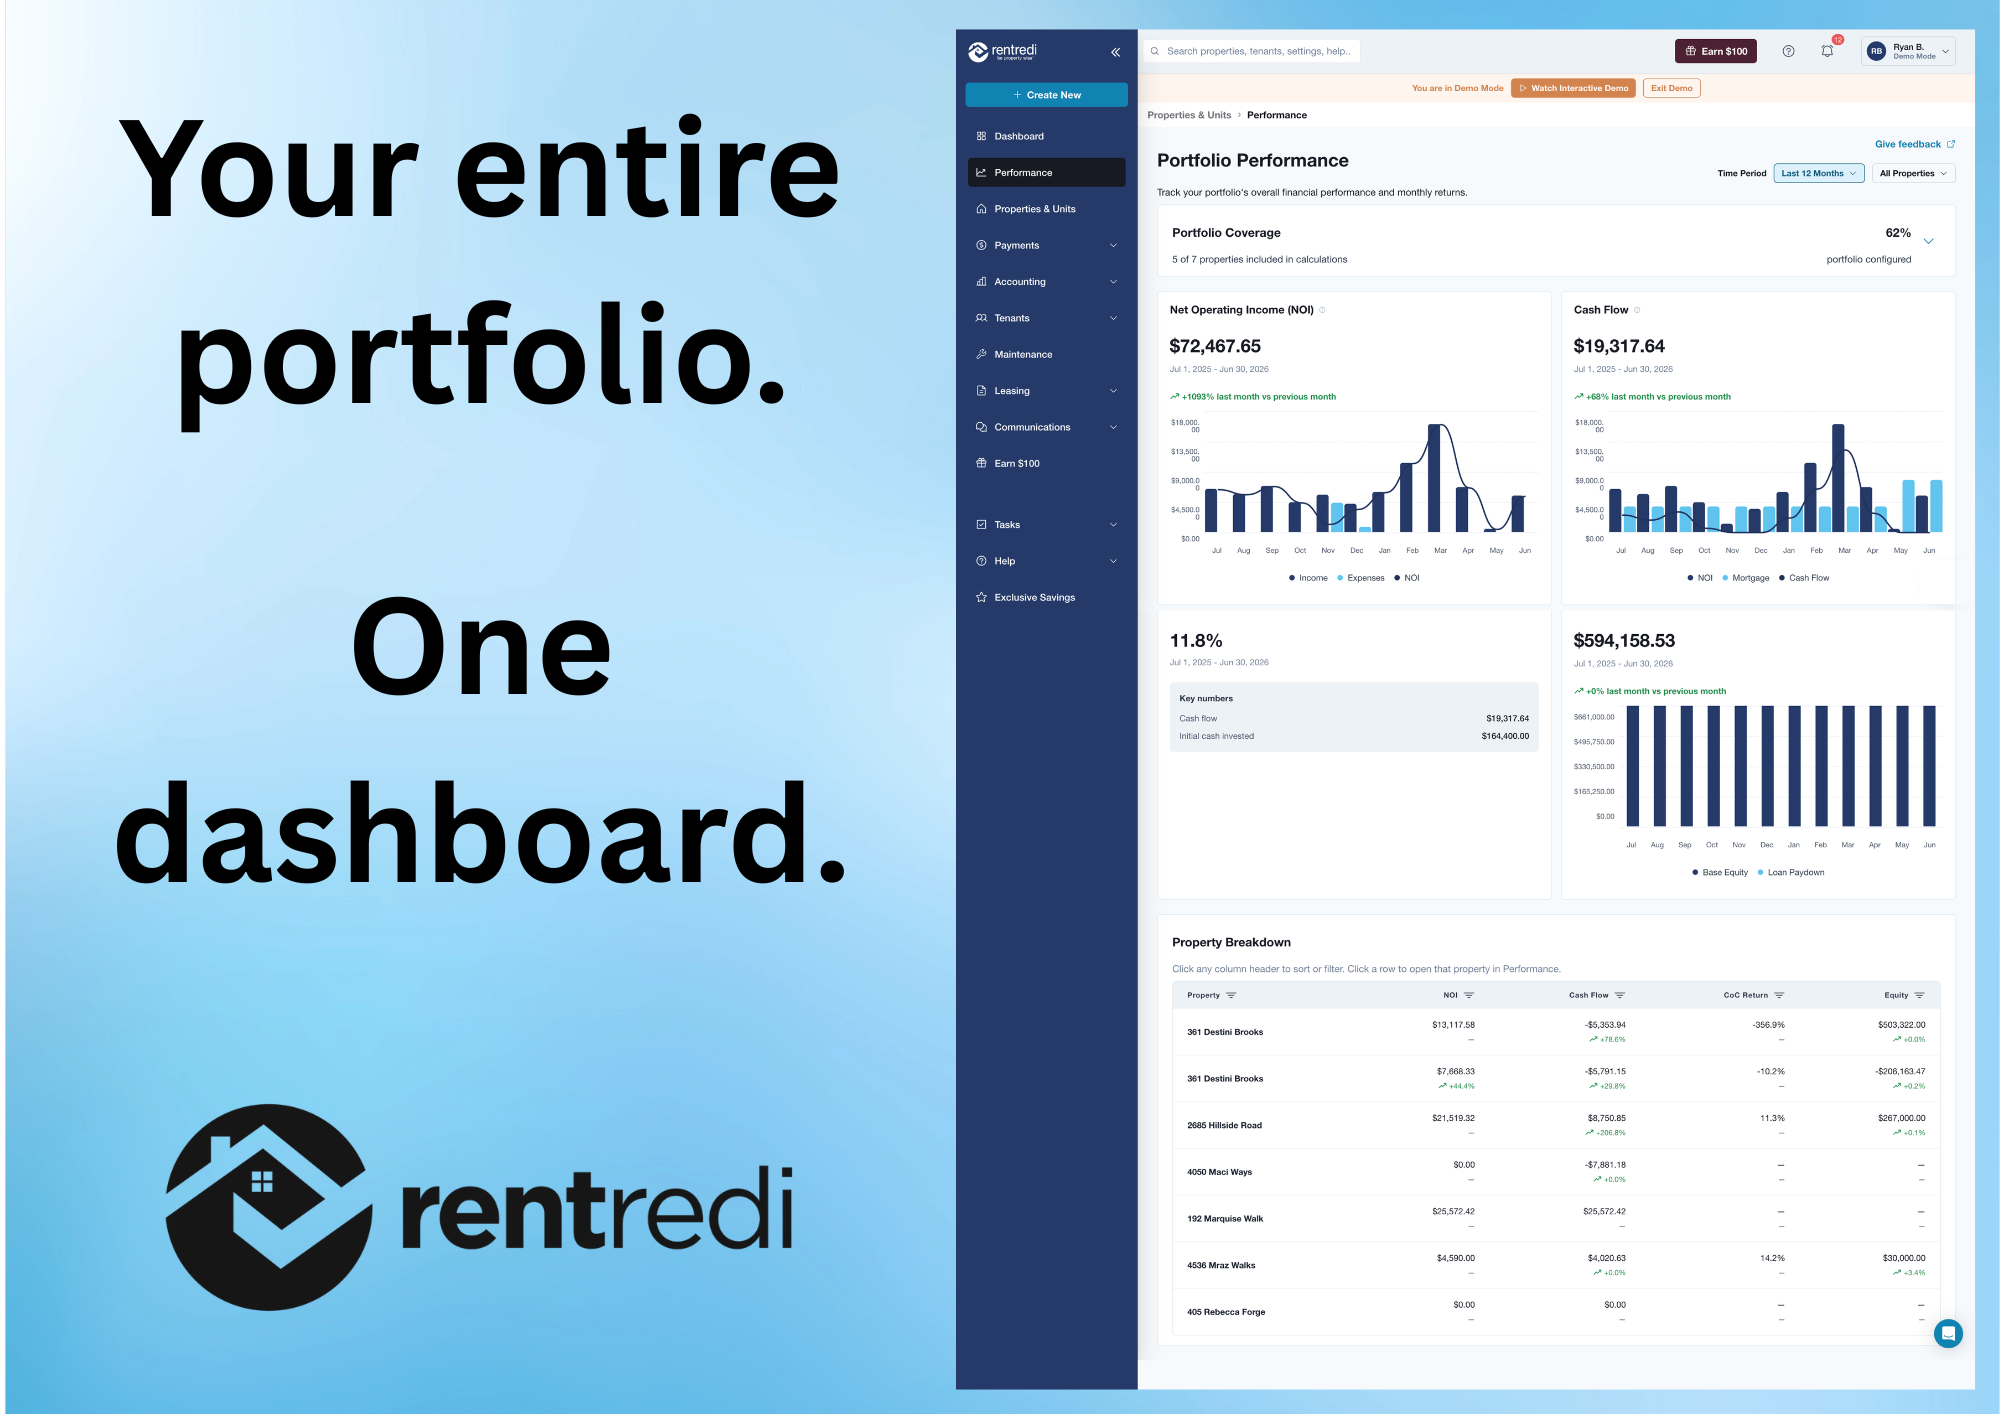
NEW YORK, July 01, 2026 (GLOBE NEWSWIRE) -- RentRedi, the rental management software that improves cash flow for rental owners, announced the launch of the Portfolio Performance dashboard that gives rental owners a real-time, aggregated view of their entire portfolio's financial health at a glance. Building on RentRedi's original property-level performance tracking, Portfolio Performance rolls up Net Operating Income (NOI), cash flow, cash-on-cash return, and estimated equity across every property in a landlord's account, giving investors the full picture of how their rental portfolio is performing at a glance.
Key Takeaways
- Portfolio Performance is a built-in financial analytics dashboard within RentRedi, providing enterprise-grade portfolio tracking.
- Displays NOI, Cash Flow, Cash-on-Cash Return, and Equity aggregated across the full portfolio in real time.
- Includes a property breakdown section showing each rental property's four key metrics and month-over-month trends at a glance.
- Pulls automatically from rent collection and expense tracking data already recorded in RentRedi.
- A Portfolio Coverage section guides landlords through adding any initial mortgage, equity, or cash invested data, and the dashboard then runs automatically with no additional input or effort.
- Designed based on feedback from landlords to help them improve cash flow, grow faster, and make better decisions about their rental businesses
From Property-Level Insight to Portfolio-Wide Clarity
RentRedi introduced Portfolio Performance to help independent landlords track the financial health of individual rental properties without spreadsheets or manual calculations. Portfolio Performance takes that foundation and scales it: rather than viewing each property in isolation, rental owners can now see a unified snapshot of their entire rental business, along with a property breakdown that shows how each rental property compares to the others month over month.
The aggregated Portfolio Performance dashboard tracks four metrics that matter most when building long-term wealth through rental properties:
- Net Operating Income (NOI)
- Cash Flow
- Cash-on-Cash Return
- Estimated Equity
How the Four Metrics Work Together
By connecting rent payments, expense tracking, and mortgage details, Portfolio Performance automatically calculates four metrics to give landlords a complete picture of performance:
-
Net Operating Income (NOI) measures gross rental income minus operating expenses before mortgage payments, revealing the core profitability of each property independent of financing. Expenses flow directly from RentRedi's expense tracking and maintenance management tools and update dynamically as transactions are logged.
-
Cash Flow is the money remaining after both operating expenses and mortgage payments, making it the clearest indicator of what the portfolio is actually producing each month. RentRedi generates amortization schedules from the mortgage details landlords enter and updates cash flow in real time as rent is collected and expenses are recorded.
-
Cash-on-Cash Return measures how efficiently invested capital is working by comparing annual pre-tax cash flow to total cash put into the deal. Because it draws from live cash flow data, the return percentage updates automatically as income, expenses, or mortgage balances change.
-
Estimated Equity tracks ownership growth across the portfolio by calculating property value minus remaining loan balance. As loan balances decrease or property values are updated, equity adjusts automatically, giving landlords a clear view of long-term wealth accumulation in real time.
A More Cohesive, Big Picture View
These four metrics aren’t isolated numbers; they build on each other:
- Income and expenses drive NOI
- NOI and debt determine Cash Flow
- Cash Flow compared to invested capital defines Cash-on-Cash Return
- Loan paydown and appreciation grow Equity
Rental owners and independent landlords on RentRedi already love the ability to easily see the answer to: "How much rent has come in this month, who paid, and what’s left?" Now, these metrics together bring that same ease to answering: "How is my portfolio performing, and why?”
"Portfolio Performance gives landlords the confidence and visibility to act strategically and offload any manual work of the past to RentRedi," said RentRedi Founder and CEO Ryan Barone. "When your entire portfolio is visible in one dashboard, you see which properties are driving growth, which ones are a drag on performance, and where your biggest opportunities are. That kind of clarity is what empowers good landlords to become great, successful investors."
Professional-Grade Analytics Built for Independent Landlords
Institutional investors have long relied on portfolio-level dashboards and financial modeling tools to manage their holdings. Portfolio Performance brings that same level of visibility to independent rental owners without the need for spreadsheets, manual calculations, and switching between property views.
The 3 top benefits of the RentRedi Portfolio Performance Dashboard:
- See the financial health of the entire rental portfolio in a single, real-time dashboard.
- Track month-over-month trends across every property to identify what is growing, what is a drag on performance, and why.
- Make smarter hold-or-sell decisions with live NOI, cash flow, return, and equity data across all properties.
See Every Property. Know Your Whole Portfolio.
The new portfolio-wide view gives rental owners a complete financial picture without toggling between individual property dashboards. The aggregated view pulls income from rent collection and expenses from RentRedi's accounting section automatically, so the numbers stay current as transactions are recorded. Landlords who have already been using Portfolio Performance at the property level will see that data rolled up immediately.
The property breakdown section lets landlords see where each asset stands today, and also how it is trending. Clear month-over-month comparisons make it easy to spot whether a property is improving or underperforming, and act on it.
“Landlords began asking me: In order to become one of the fastest growing companies in the country, RentRedi must have built real-time dashboards of what was working and why. So why can’t landlords have the same? Why can’t landlords have the most critical metrics for their rental business in a real-time, no effort, automatically-calculated dashboard?" added Ryan Barone. “That’s what we created. It gives landlords valuable, actionable visibility without any of the work, so they can make better decisions, grow faster, reduce risk, and improve returns.”
Watch this video to see how the RentRedi Portfolio Performance dashboard works: https://www.youtube.com/shorts/N0hxqHR2aP4
Portfolio Performance is live for RentRedi subscribers. Rental owners and property managers can access it by clicking the new “Performance” option in the app.rentredi.com sidebar. Visit RentRedi for more information or to start tracking your full portfolio performance today.
Frequently Asked Questions (FAQs)
What is RentRedi’s Portfolio Performance dashboard?
Portfolio Performance is a built-in financial analytics suite within RentRedi that helps landlords track both individual rental property and full portfolio performance in real time. It visualizes key investment metrics like Net Operating Income (NOI), Cash Flow, Cash-on-Cash Return, and Estimated Equity in a single, easy-to-understand dashboard.
How does Portfolio Performance calculate NOI?
The dashboard calculates Net Operating Income (NOI) by subtracting operating expenses, such as taxes, insurance, repairs, and utilities, from gross rental income. Income data flows directly from rent collected in RentRedi, while expenses pull from accounting and maintenance records, ensuring real-time updates as transactions are logged.
How does RentRedi track cash flow?
Cash flow is calculated by subtracting mortgage payments from NOI. Landlords enter their loan details, including interest rate and term, and RentRedi automatically generates an amortization schedule. As rent, expenses, or loan balances change, cash flow updates dynamically within the dashboard.
What is cash-on-cash return in real estate?
Cash-on-cash return measures the annual pre-tax cash flow generated by a property compared to the total cash invested, typically including down payment, closing costs, and renovations. RentRedi calculates this percentage automatically using live property performance data, helping landlords evaluate capital efficiency.
How does Portfolio Performance estimate property equity?
Estimated Equity is calculated as property value minus remaining loan balance. RentRedi combines mortgage amortization data with the landlord’s estimated property value — supported by fair market value data where available — to show ownership growth over time.
Who is Portfolio Performance designed for?
Portfolio Performance is built for independent landlords and property managers who want professional-grade rental property analytics without needing to choose between manually updating spreadsheets or buying expensive enterprise software. It’s designed to support hands-on owners focused on long-term financial growth and disciplined portfolio management.
Is Portfolio Performance included with RentRedi?
Yes. Portfolio Performance is available to RentRedi subscribers and can be accessed by clicking the new “Performance” option in the app.rentredi.com sidebar.
How does this help landlords grow their rental portfolio?
By centralizing rental property performance metrics in one place, Portfolio Performance helps landlords make informed hold, sell, refinance, or reinvest decisions. With clear visibility into ROI, cash flow trends, and equity growth, landlords can scale with greater confidence and clarity.
About RentRedi
RentRedi is the premier property management software that improves cash flow from rentals by providing tools and metrics that help rental property owners unlock the full earning potential of their investments. RentRedi eliminates the manual work involved in the renting process, including listings, applications, tenant screening, rent collection, maintenance coordination, and accounting. Additionally, RentRedi’s AI, data intelligence, and insights are leveraged by investors to optimize portfolios, boost retention, reduce turnover, and improve the lives of everyone in the rental process.
Founded in 2016, RentRedi is VC-backed and a proven PropTech leader, recognized by the Inc. 5000, Deloitte Technology Fast 500, Inc. Power Partners, Fast Company’s Next Big Things in Tech, and HousingWire’s Tech100. With thousands of 5-star reviews, more than $35 billion in assets under management, and nearly 300,000 landlords and tenants using its platform, RentRedi partners with leading technology providers including Zillow, TransUnion, Experian, Equifax, Realtor.com, Lessen, Thumbtack, Plaid, and Stripe to create the best customer experience possible. Learn more at RentRedi.com.
A photo accompanying this announcement is available at https://www.globenewswire.com/NewsRoom/AttachmentNg/741e3263-745a-4d66-b52f-2822d6acf23c

RentRedi Media Contact:
Jennifer Tolkachev
jen@rentredi.com
![]()
RentRedi Portfolio Performance Dashboard
Your entire rental portfolio, tracked in real time. RentRedi's Portfolio Performance dashboard shows NOI, cash flow, cash-on-cash return, and equity across every property you own — all in one place.
Legal Disclaimer:
EIN Presswire provides this news content "as is" without warranty of any kind. We do not accept any responsibility or liability for the accuracy, content, images, videos, licenses, completeness, legality, or reliability of the information contained in this article. If you have any complaints or copyright issues related to this article, kindly contact the author above.
